
Is Your Neighbor's Radon Level Lower Than Yours?

It's common for homeowners to compare notes with neighbors. Maybe someone down the street recently tested their home and reported low radon readings, leaving you wondering whether your home should have similar results. Surprisingly, that isn't always the case. Even houses built side by side can have very different radon levels.
Many homeowners begin by researching Average Radon Levels by State to understand broader trends. While state averages, local radon maps, and county statistics provide valuable information, they don't tell the entire story. Individual homes respond differently to soil conditions, ventilation patterns, weather, and construction characteristics.
Understanding why radon varies from one house to another can help homeowners make more informed decisions and avoid relying solely on neighborhood assumptions.
Why Your Neighbor's Results Don't Guarantee Your Results
One of the most common assumptions homeowners make is that houses in the same neighborhood should have similar radon levels.
That seems reasonable at first.
After all, neighboring homes often share:
-
Similar construction dates
-
Comparable square footage
-
The same ZIP code
-
Similar weather conditions
However, indoor radon levels are influenced by numerous factors that can differ significantly from one property to another.
These differences help explain why two homes on the same street may produce very different readings.
Understanding this concept is particularly important when reviewing Average Radon Levels by State, since averages are designed to show broad trends, not individual conditions.
Can radon vary from house to house?
Homeowners frequently ask, "Can radon vary from house to house?" The answer is yes.
Even homes located on the same street can have significantly different radon levels. Factors such as soil conditions, foundation characteristics, ventilation, HVAC operation, and seasonal weather patterns all influence how radon enters and moves through a home.
That's why professionals recommend testing individual homes rather than relying solely on a neighbor's results or regional averages.
Same Street, Different Results
Imagine two homes built in the same year on the same street.
|
Home |
Long-Term Average |
|
Home A |
1.9 pCi/L |
|
Home B |
7.1 pCi/L |
Even though both homes share the same ZIP code and similar construction, differences in foundation openings, soil conditions, airflow, and pressure changes can lead to dramatically different results.
This is one reason professionals recommend testing individual homes rather than relying on neighborhood assumptions.
What Average Radon Levels by State Can and Can't Tell You
Many homeowners begin their research by reviewing Average Radon Levels by State to understand whether radon is common where they live. State averages provide useful context, helping identify regions where elevated levels are more frequently reported. However, these averages describe broad patterns, not individual homes.
State averages provide useful context and can help answer questions such as:
-
Is radon common where I live?
-
Have elevated readings historically been reported in my state or province?
-
Should testing be part of my indoor air quality plan?
However, state averages cannot tell you:
-
What is your home's radon level today?
-
Whether your basement will behave the same way as your neighbor's.
-
How weather, ventilation, or seasonal changes may affect your readings.
That's because regional averages describe broad trends, while radon levels are ultimately determined by the unique characteristics of each home.
State Averages vs Individual Home Testing
|
Information Source |
Useful For |
Limitations |
|
Average Radon Levels by State |
Understanding regional trends |
Too broad for individual homes |
|
County Radon Levels |
Local patterns |
Homes vary significantly |
|
Interactive Radon Risk Maps |
Visualizing risk |
Predictive only |
|
Neighbor Test Results |
Additional context |
Cannot predict your home's readings |
|
Continuous Monitoring |
Understanding long-term patterns |
Requires ongoing measurement |
County Radon Levels Can Provide Helpful Clues
In addition to state averages, county radon levels can provide a more localized view of regional patterns. Historical testing data and geological conditions may help identify areas where elevated readings are more common.
However, county radon data has limitations. It cannot account for differences in foundations, renovations, ventilation, or seasonal changes that influence individual homes. That's why county averages are best viewed as helpful context rather than a substitute for testing.
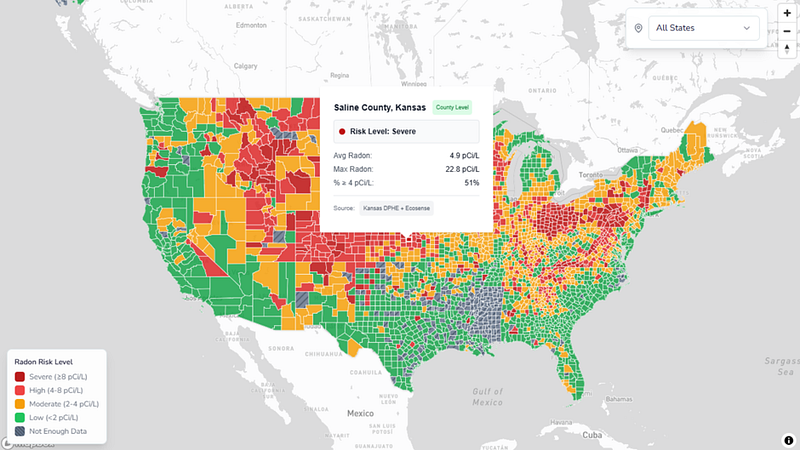
Using an Interactive Radon Risk Map
Interactive radon risk maps make it easier to explore local trends and understand how radon potential varies across regions. They can help homebuyers, relocating families, and homeowners identify areas with historically elevated readings and visualize EPA radon zones and county-level patterns.
Like a weather forecast, these maps estimate probability, not certainty. They provide valuable context, but they cannot determine the radon level inside a specific home.
Why Home Characteristics Matter More Than You Might Think
Many factors influence how a house interacts with soil gases.
-
Basement Configuration: Finished basements, crawl spaces, and slab foundations all behave differently.
-
Home Renovations: Changes such as:
- New windows
- Additional insulation
- Basement remodeling
- HVAC upgrades
Can alter airflow and pressure conditions.
-
Seasonal Weather: Heavy rain, snow cover, and temperature changes may influence indoor measurements.
-
Ventilation Habits: Opening windows, using fans, and changing HVAC settings can affect air movement throughout the home.
These factors explain why homeowners should avoid assuming that their neighbor's readings automatically apply to their own property.
Why Radon Maps and State Averages Are Still Valuable
Although individual testing remains essential, resources such as Average Radon Levels by State, county radon levels, and an interactive radon risk map provide meaningful context.
They help homeowners:
-
Understand Regional Patterns: Broad data can reveal areas where elevated levels are more common.
-
Raise Awareness: Maps encourage homeowners to consider testing their indoor air quality.
-
Support Real Estate Decisions: Buyers relocating to unfamiliar regions may benefit from understanding local trends.
-
Provide Educational Value: Learning about regional patterns helps homeowners make informed choices.
From Maps to Measurements: Why Homeowners Want More Than State Averages
As interest in indoor air quality continues to grow, tools are making radon awareness more accessible.
Modern radon monitoring technology has also evolved significantly.
At Ecosense, one of the most common questions homeowners ask is whether a state average or a neighbor's test result can predict their own risk. In reality, every home behaves differently.
Ecosense Radon Map helps homeowners explore regional patterns and community-level trends. However, maps are only the beginning. Many homeowners eventually want answers to questions like:
-
Do my radon levels change during winter?
-
Did a basement renovation affect readings?
-
Does the weather influence my home's results?
Continuous radon monitoring helps answer those questions by showing how conditions change over time instead of relying on assumptions or a single snapshot.
Why Continuous Monitoring Adds Another Layer of Confidence
Even after testing, indoor conditions may change over time.
Several factors influence fluctuations, including:
-
Seasonal weather
-
Home improvements
-
Ventilation changes
-
Foundation settling
Continuous monitoring allows homeowners to observe these changes and gain a broader understanding of long-term patterns.
Instead of comparing your home to your neighbor's, continuous monitoring helps you understand how your own house behaves over weeks, months, and seasons.
That information is often far more valuable than statewide averages or neighborhood assumptions.
Final Thoughts
Researching Average Radon Levels by State is an excellent way to understand regional trends, but averages tell only part of the story.
The answer to the question: Can radon vary from house to house? It is a clear yes. Differences in soil conditions, foundation characteristics, weather patterns, and airflow mean that neighboring homes can experience very different indoor environments.
Resources such as county radon levels, an interactive radon risk map, and the Ecosense Radon Map provide valuable context, but home-specific testing and ongoing monitoring remain the most effective ways to understand your unique indoor conditions.
Ultimately, your home's story is more important than your neighbor's, and understanding that difference is the key to making informed decisions with confidence.
Frequently Asked Questions
How often should I retest my home for radon?
Experts generally recommend retesting after major renovations, HVAC changes, or every few years. Continuous monitoring can also help track long-term trends.
Can weather affect indoor radon levels?
Yes. Rain, snow cover, temperature differences, and changes in atmospheric pressure can influence how radon enters a home.
Do newer homes have lower radon levels?
Not necessarily. New and old homes alike can experience elevated radon levels. Age alone does not determine risk.
Does having no basement mean my home is safe from radon?
No. Radon can enter homes through slab foundations, crawl spaces, and basements
Should I retest after installing a mitigation system?
Yes. Follow-up testing helps confirm that the system is working effectively and maintaining lower radon levels over time.